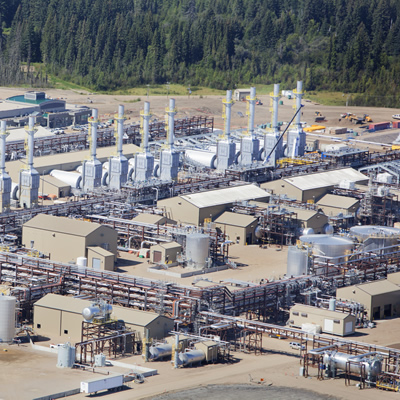
Cenovus' Christina Lake production operations. — Photo courtesy Cenovus Cenovus Energy Inc. (TSX: CVE) (NYSE: CVE) continued to deliver strong and r
Cenovus' Christina Lake production operations. — Photo courtesy Cenovus
Cenovus Energy Inc. (TSX: CVE) (NYSE: CVE) continued to deliver strong and reliable operating performance in the second quarter of 2016. The company remains on track with its plans to bring on two new oil sands expansion phases and achieve up to $500 million in capital, operating and general and administrative (G&A) cost reductions compared with its original 2016 budget.
“We’ve achieved significant sustainable improvements in our cost structure over the last year and a half, and we’ll remain vigilant on costs to maximize our competitive position in this challenging and volatile commodity price environment,” said Brian Ferguson, Cenovus President & Chief Executive Officer. “Our reduced cost base and strong operational performance, coupled with an improvement in benchmark oil and natural gas prices from the lows reached earlier this year, contributed to a solid second quarter.”
- Decreased per-barrel oil sands operating costs by 24% and per-barrel conventional crude oil operating costs by 9% compared with the second quarter of 2015
- Achieved production at Foster Creek of almost 69,000 barrels per day (bbls/d) net in June. Second-quarter production was nearly 65,000 bbls/d net, 11% higher than in the same period of 2015. Foster Creek is on track to exit the year with volumes above 70,000 bbls/d net
- Increased production at Christina Lake to more than 78,000 bbls/d net, 8% higher than in the second quarter of 2015
- The Foster Creek phase G and Christina Lake phase F expansion projects remain on track to add incremental production in the third quarter
- Exited the quarter with nearly $8 billion in liquidity, including $3.8 billion in cash, $4 billion in unused credit facilities, and net debt to capitalization of 17%
Foster Creek
- Production averaged 64,544 bbls/d net in the second quarter of 2016, an 11% increase from the same period of 2015.
- Operating costs at Foster Creek declined 24% to $10.15/bbl in the quarter. Non-fuel operating costs were $8.51/bbl, a 19% drop from a year earlier.
- The steam to oil ratio (SOR), the amount of steam needed to produce one barrel of oil, was 2.9 for the second quarter compared with 2.3 in the same period of 2015. The SOR is expected to decrease as new well pads come online later this year.
- Netbacks, including realized hedging gains, were $13.46/bbl for the quarter, a 45% decrease from the same quarter of 2015.
Christina Lake
-
Production averaged 78,060 bbls/d net in the second quarter of 2016, an 8% increase from the same period a year earlier.
-
Operating costs were $6.35/bbl in the quarter, a decline of 23% from a year earlier. Non-fuel operating costs were $4.93/bbl, 18% lower than in the same period in 2015.
-
The SOR was 1.8 during the second quarter compared with 1.7 a year earlier.
-
Netbacks, including realized hedging gains, were $18.74/bbl in the quarter, down 42% from the same period in 2015.
-
Total conventional oil production decreased 20% to 55,476 bbls/d in the second quarter of 2016 compared with the same quarter a year ago, primarily due to natural reservoir declines and the 2015 sale of Cenovus’s royalty and fee land business. The divested assets contributed an average of 4,300 bbls/d of production in the second quarter of 2015.
-
Operating costs were $14.00/bbl in the quarter, 9% lower than in the second quarter of 2015, primarily due to lower repairs and maintenance, chemical, electricity and workforce costs. Page 5 Q2 2016
-
Natural gas production averaged 399 million cubic feet per day (MMcf/d) in the second quarter of 2016, down 11% from the same period a year earlier, primarily due to expected natural declines and the company’s 2015 sale of its royalty and fee land business.
-
Operating costs fell 7% to $1.06 per thousand cubic feet (Mcf) in the quarter compared with the same period a year earlier.
-
Cenovus’s Wood River Refinery in Illinois and Borger Refinery in Texas, which are jointly owned with the operator, Phillips 66, continued to have strong operational performance in the second quarter of 2016, including: processing a combined average of 458,000 bbls/d gross of crude oil (100% utilization) compared with 441,000 bbls/d gross in the same period in 2015 (96% utilization) producing a combined average of 483,000 bbls/d gross of refined products compared with 462,000 bbls/d gross a year earlier.
Cenovus had operating cash flow of $193 million from refining and marketing in the quarter compared with $300 million in the second quarter of 2015. The company’s refining operating cash flow is calculated on a first-in, first-out (FIFO) inventory accounting basis. Using the last-in, first-out (LIFO) accounting method employed by most U.S. refiners, Cenovus’s operating cash flow from refining and marketing would have been $107 million lower in the second quarter of 2016. In the second quarter of 2015, operating cash flow would have been $101 million lower on a LIFO reporting basis.
Related Stories
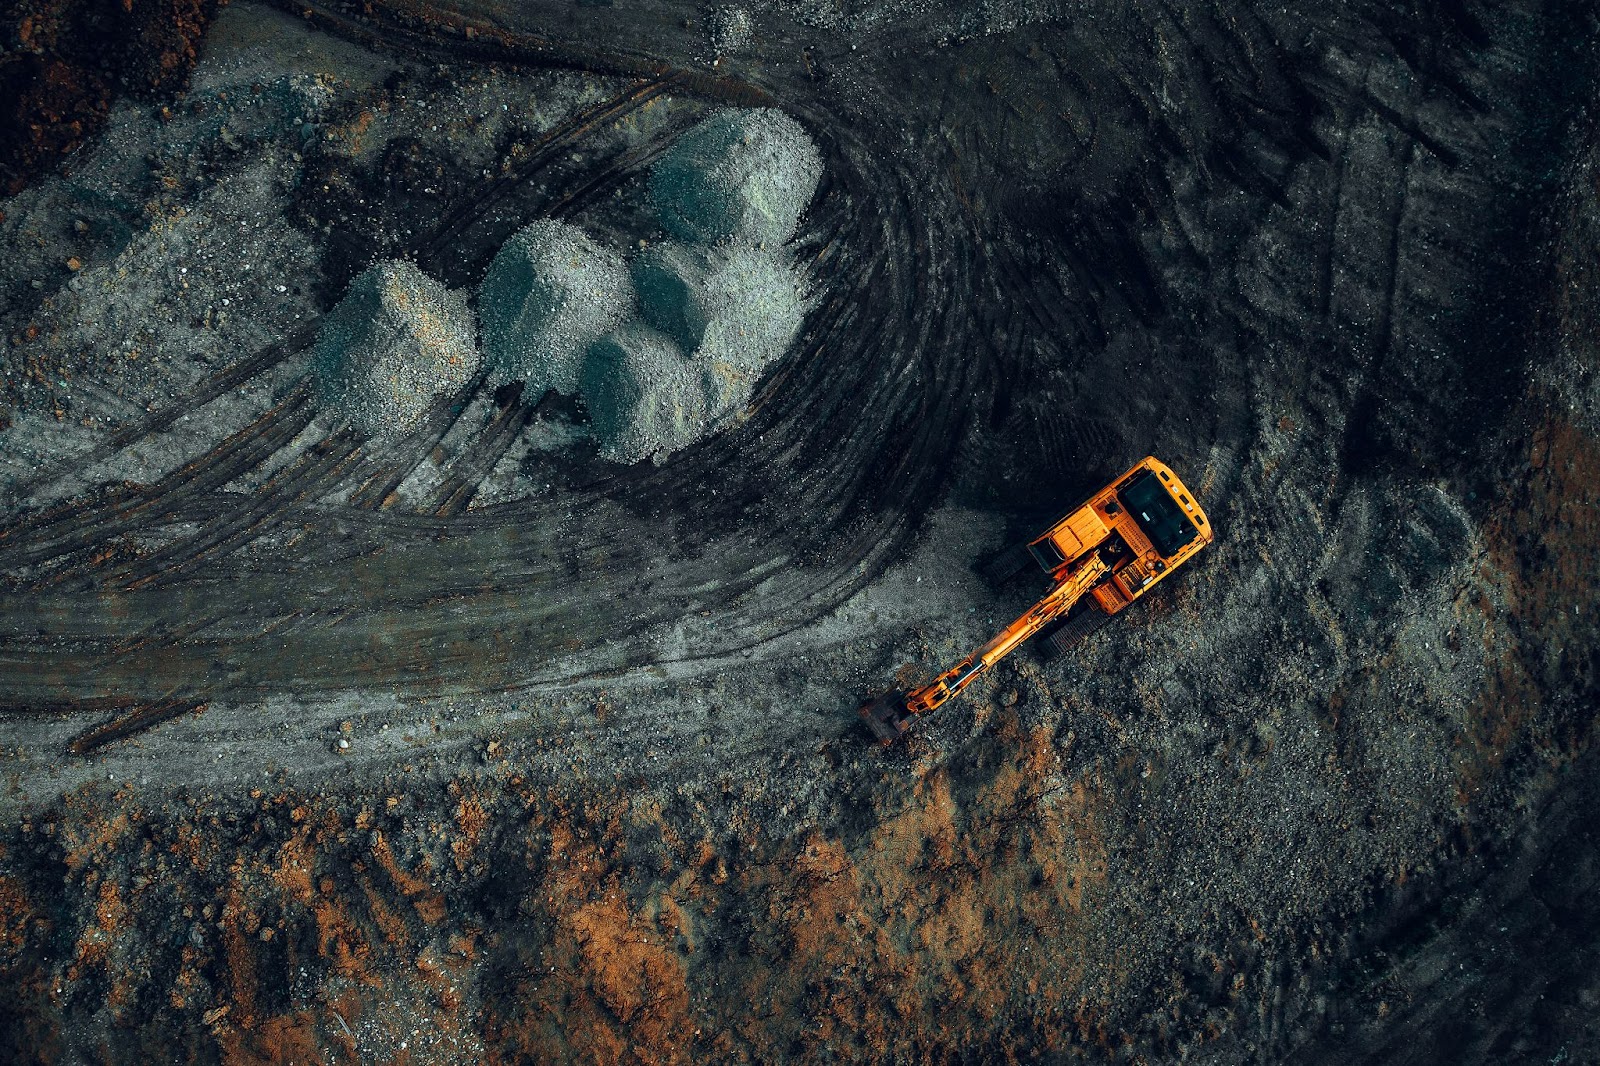
Satellite Insights into Mining’s Ecological Impact
More than 3 days ago
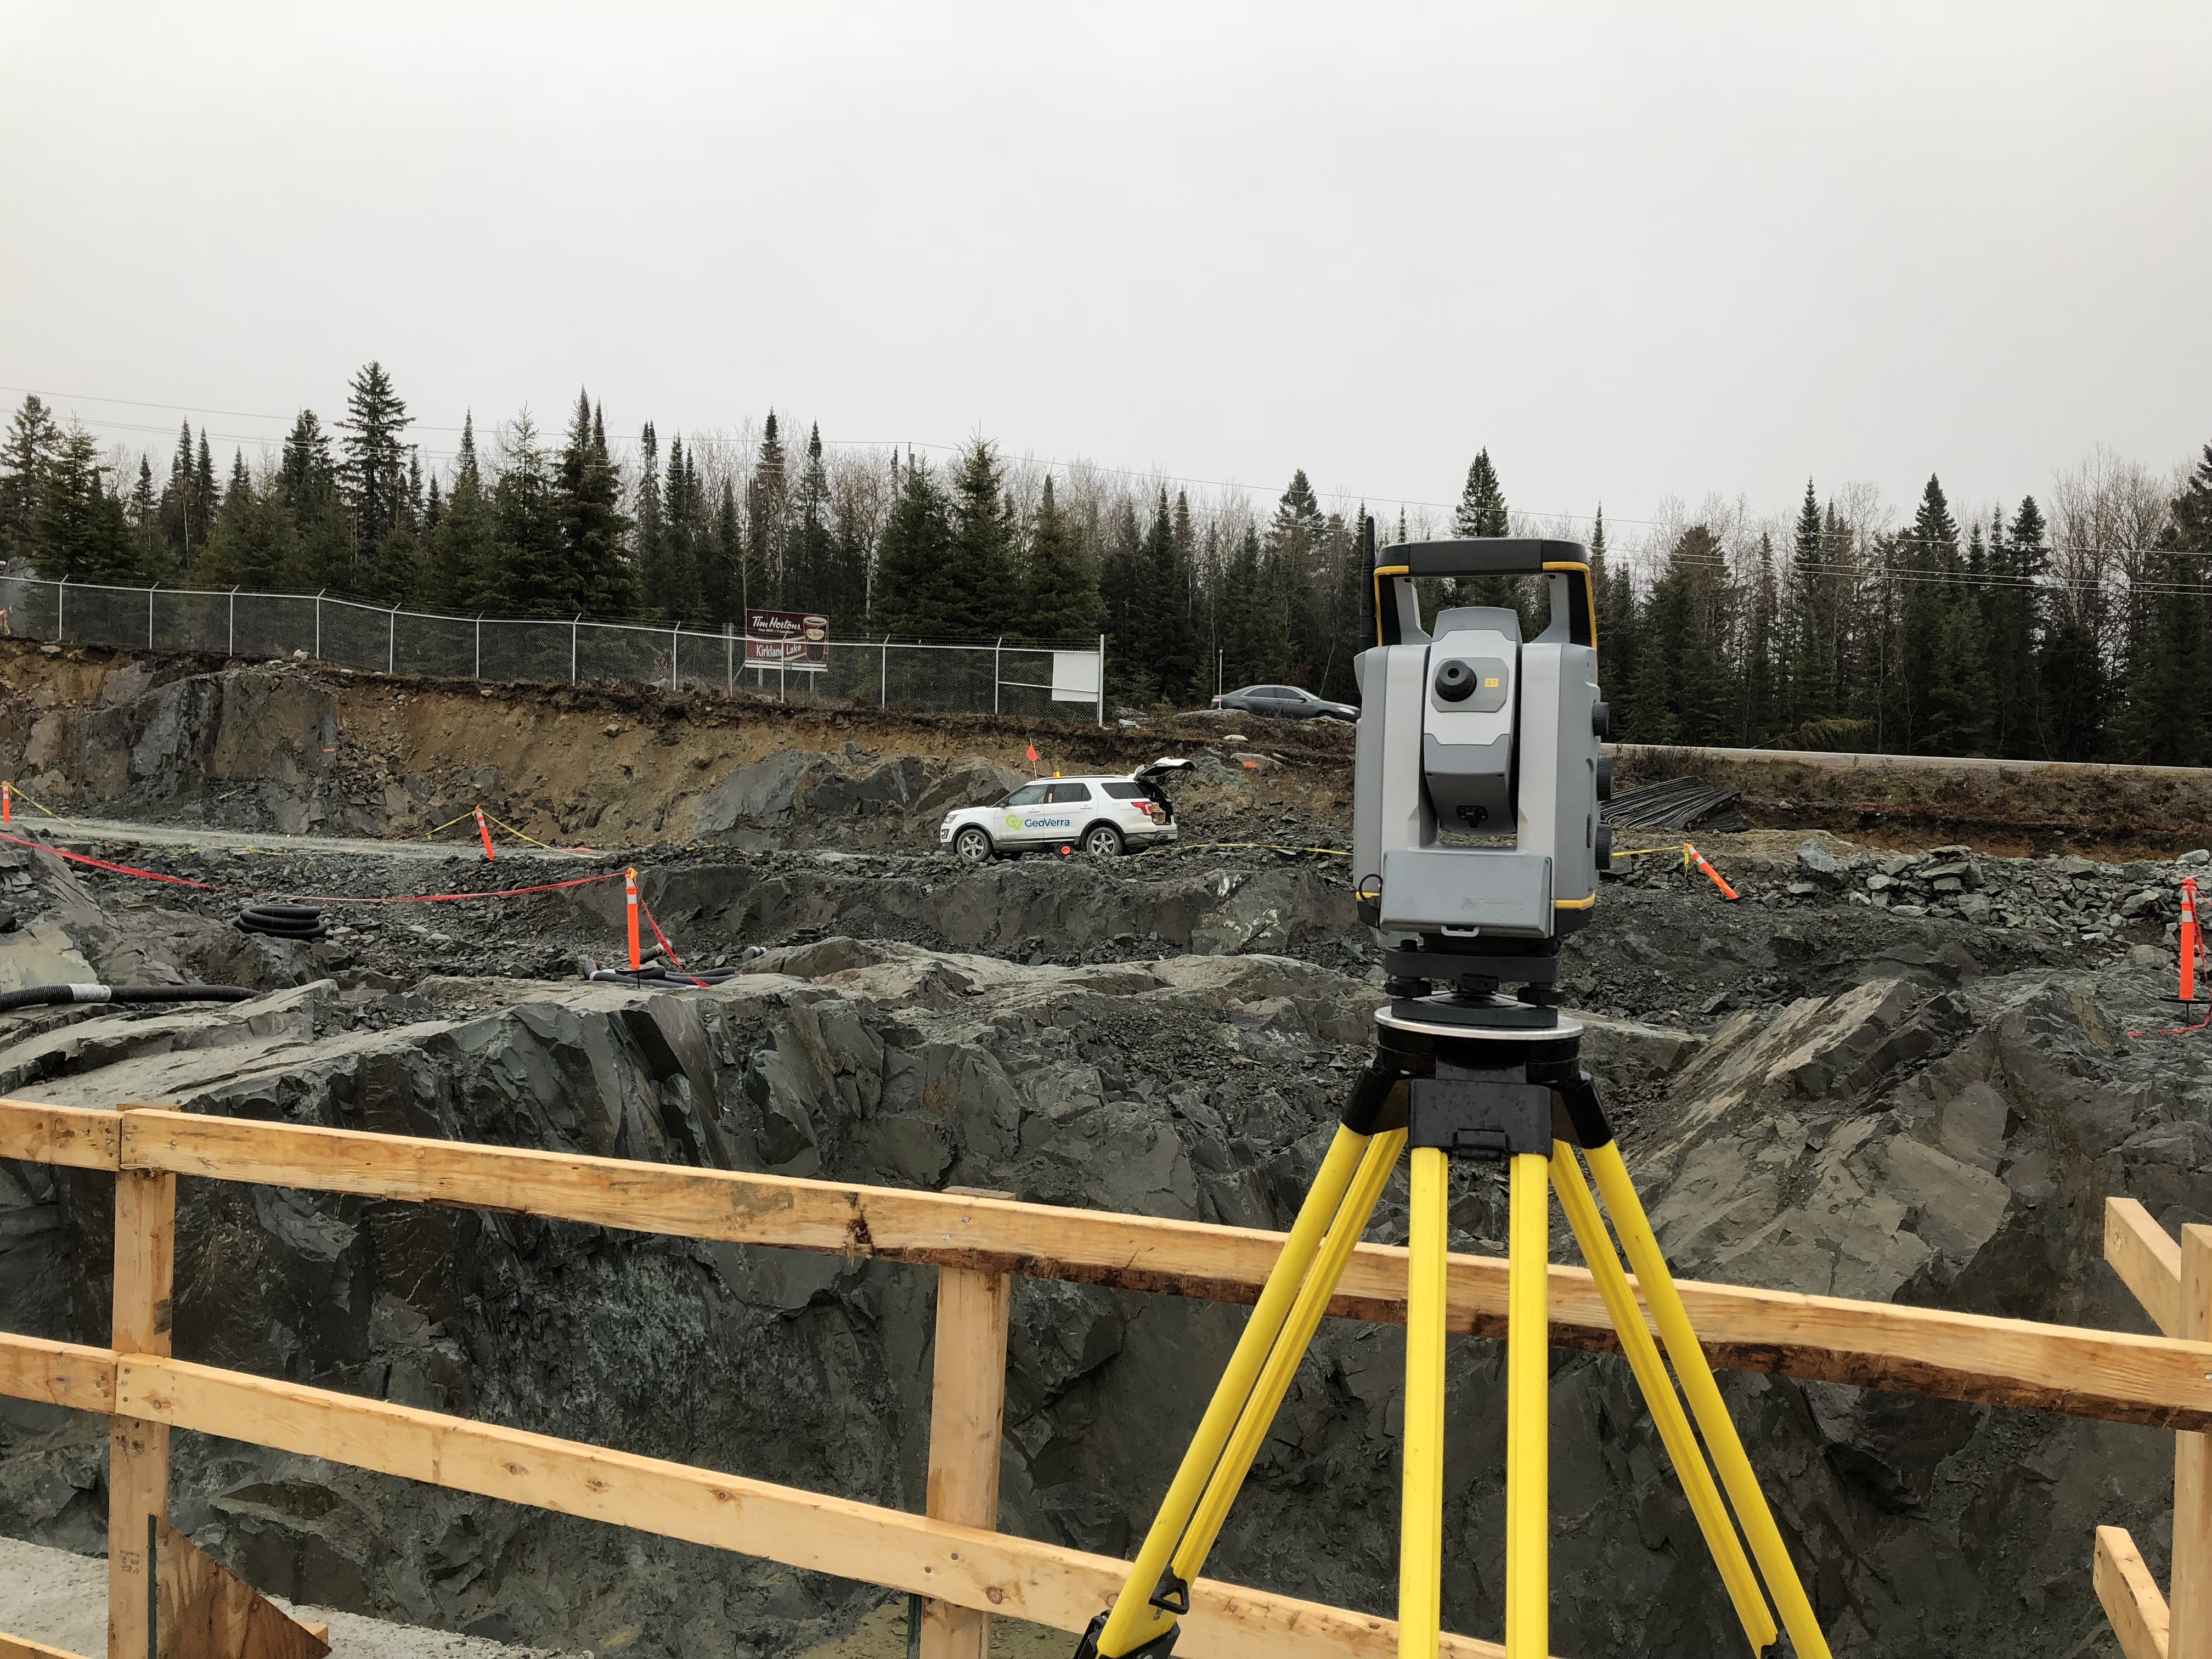
The Future of Mining Site Development: Reducing Downtime with Smart Surveying & Monitoring
More than 3 days ago
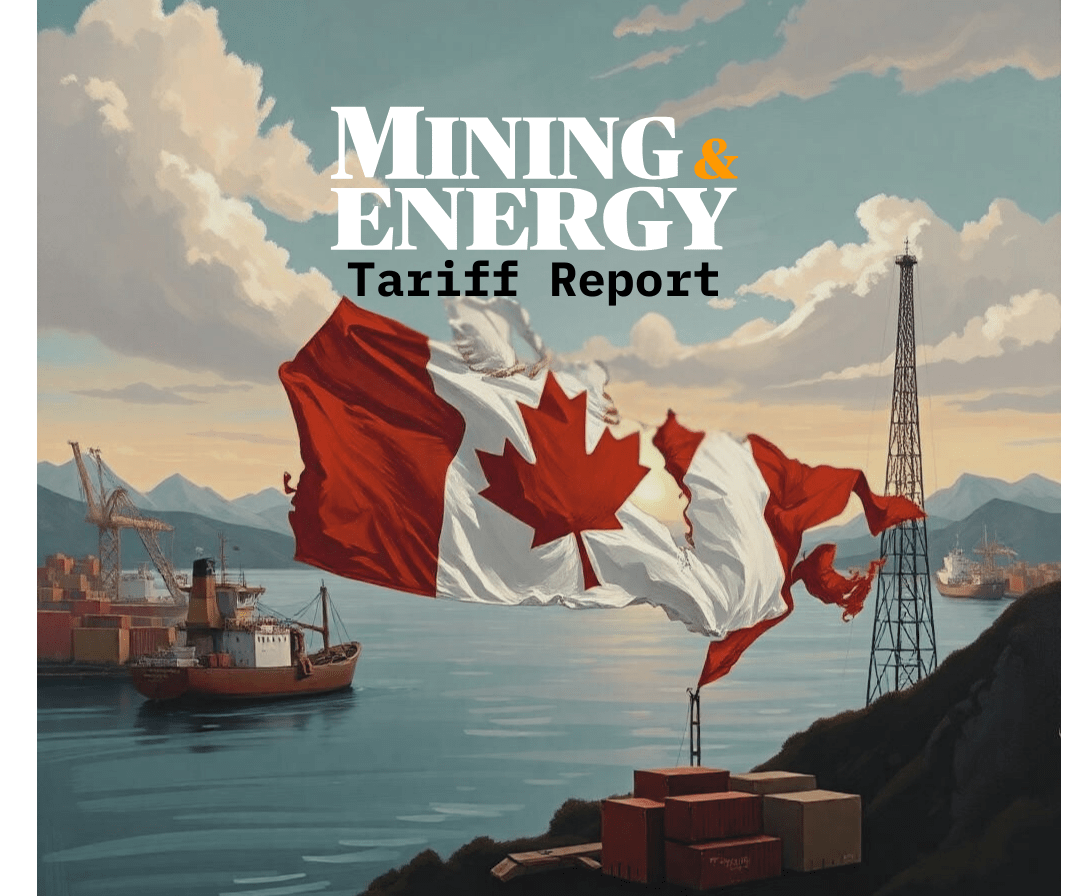
Saskatchewan's Potash may be Canada's Trump Card
More than 3 days ago

National Energy Emergency
More than 3 days ago

Westshore Terminals Coal Fire 2024
More than 3 days ago